The Cutting Edge of Medical Technology Content, Community & Collaboration
Microsoft Excel is a wonder package, and in saying this, I am not exaggerating or taking sides with Mr. Gates’s developers. They have created a program that is so versatile and so tailor-made for just so many industries that you would wonder from where they got the idea to do this. I reckon they must have worked extensively with the industry closely in understanding its needs and implemented all the details with devilish diligence.
The MS Excel program is simply so exhaustive and comprehensive you would feel lost if you are not familiar with it. Once you gain an element of familiarity, it works wonders for most of your needs. Does it surprise that MS Excel is a superhit with a range of industries from finance and compliance and from teaching to sales? All that is needed is a bit of comfort in understanding MS Excel’s features to get to exploit the program to the limit.
So, do you want an easy fix for your MS Excel spreadsheet techniques? Read this!
Like I said, the uses of MS Excel are extremely varied and vast. So, if one were to write down want an easy fix for your MS Excel spreadsheet techniques, it would take a manual! Let me try to make your usage of MS Excel a little easier by offering you tips on a few key features of MS Excel:

Select all with one click
Often, I have noticed users finding it complicated to drag the arrow to all the areas they want to select in the Excel worksheet. I have myself sometimes lost patience with it! I discovered a very simple method of doing this (apart of course from using Control A): click on the arrow (half triangle) at the left corner of the row and you’re done!
Pivot Tables
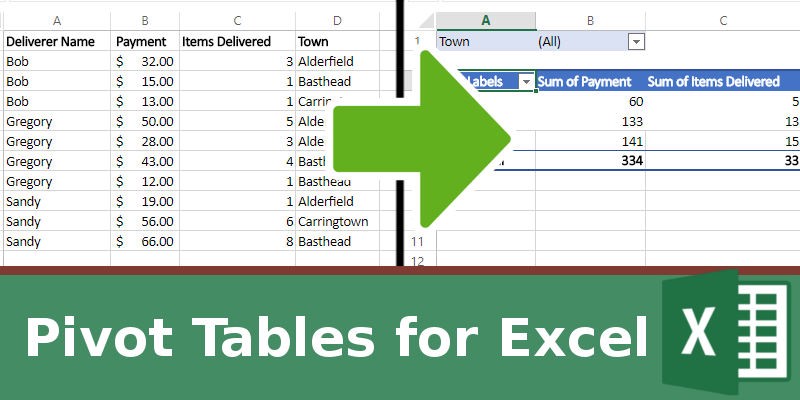
Pivot Tables are a quick way of organizing an enormous number of varied and disparate data sets. It helps in areas such as getting to understand the exact number of units sold of a particular item in a shop and the amount earned from the sale. This feature helps to organize the data quickly, meaningfully and insightfully. All that is needed for an easy fix for your MS Excel spreadsheet techniques for Pivot Tables is this:

Report Filter: To create by rows by parameters such as, in this case, pack size, manufacturer, date of arrival of stock into the inventory and expiry date
Column Labels: Helps you give a name or label to the items
Row Labels: Enables you to supplement Report Filter by qualifying the labels from the columns and can be used in any manner that the user finds easy
Value: This is the actual calculating part of the tables. It does any kind of operation you want from it like multiplication of the values based on the units sold, minimum, maximum, average, sum and so on.
Removing duplicates
Some cells can carry duplicate content depending on what kind of data go into them. All that is needed to remove the duplicates is to go to select the row or column from which you want this done; go to Data, go to Tools and hit “Remove Duplicates”.
AutoSum
This is used to obtain the sum of different values in cells. Just go to the far-right corner and click on the AutoSum option. You will have the choice of sum, average, count numbers and so on. Once you set this, it will keep doing the summing up by itself.

Open many MS Excel files and shift between them
This is one hell of a feature from MS Excel! Once you have created different files in the usual file creation mode, just click on each of them and press enter. All files will open simultaneously. And then, if you want to alternate between any of them, keep hitting control tab, just like in MS Word.
Carrier with Excel If you Loose this now? https://goo.gl/bWxnnA
Views: 31
Comment
© 2026 Created by CC-Conrad Clyburn-MedForeSight.
Powered by
![]()
You need to be a member of MedTech I.Q. to add comments!
Join MedTech I.Q.