The Cutting Edge of Medical Technology Content, Community & Collaboration
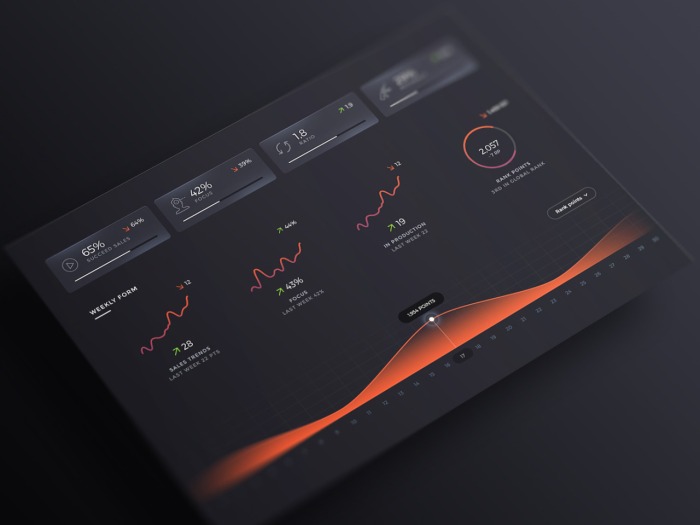
Data visualization can have a great effect on statistical presentations

It is said that a picture is worth a thousand words. This adage may appear figurative and allegorical when applied to the realm of statistics, but there is no denying the fact that a visual approach to statistics enlivens the subject like no other. A dash of pictorial work and some coloring at the right places enhance the presentation of otherwise drab statistical figures and slides dramatically.
Graphic displays illustrate the facts and truths behind statistics very artistically. They augment the appeal of what is conveyed by the statistical figures without altering or diluting the effect or the content. This is why presenting data visually is a great enhancer. It is very useful in any compliance analytics workflow.
Graphic enhancements can be used to uplift and raise the presentational aspects of statistics, but it requires skill and specific tools, because the pictorial aspect has to fit rightly into the statistical presentations. Any mismatch or mix-ups can have the opposite effect, making the statistical pictures gaudy, out of place and jarring.
Get to the ways of doing it

A two-day seminar from GlobalCompliancePanel, a highly respected provider of professional trainings for the regulatory areas, will offer thorough and complete learning on the proper ways of beautifying statistical presentations with the right mix of graphics, so that the intended purpose of embellishing is met.
James Wisnowski, who is the cofounder of Adsurgo LLC and co-author of the book, Design and Analysis of Experiments by Douglas Montgomery: A Supplem... and currently provides training and consulting services to industry and government in Design of Experiments (DOE), Reliability Engineering, Data Visualization, Predictive Analytics, and Text Mining; will be the Director at this two-day seminar.
Please visit Data visualization can have a great effect on statistical presentat... to enroll for this highly interesting seminar, which has been pre-approved by RAPS as eligible for up to 12 credits towards a participant’s RAC recertification upon full completion.
All about graphics in statistics
This seminar on data visualization will present methods using which participants can interactively discover relationships graphically. James will offer participants the foundations that will help them create better graphical information with which to accelerate the insight discovery process and improve the comprehension of reported results.
He will lead participants to an exploration of the first principles and the “human as part of the system” aspects of information visualization from multiple leading sources such as Harvard Business Review, Edward Tufte, and Stephen Few. All this will be done using representative example data sets. Best practices for graphical excellence to most effectively, clearly, and efficiently communicate a thought will be explained. He will show how to construct visualizations for univariate, multivariate, time-dependent, and geographical data. Participants are encouraged to bring laptops to follow along demonstrations in JMP (free trial download at www.jmp.com), and open source solutions such as R (https://www.r-project.org) and Tableau Public (https://public.tableau.com/s/).
Meeting the requirements of analytic solutions

As all regulated industries have now come to expect data-driven decisions; compliance regulations require analytic solutions. The starting point of these solutions is the development of data visualization for discovering relationships and finish with crisp graphs communicating results. To take the example of 21 CFR and guidance documents for the pharmaceutical, biopharmaceutical, and medical device industries; these documents specify the application of statistical methods for the following:
- Setting validation criteria and specifications
- Performing measurement systems analysis (MSA)
- Conducting stability analysis
- Using design of experiment (DOE) for process development and valida...
- Developing process control charts
- Determining process capability indices.
For each of these areas, data visualization serves as the foundation. Data visualization plays a major role in varying degrees in varied areas such as:
- meeting FDA analytical requirements for third-tier critical to quality attributes for analytical bio similarity evaluations where graphical plots and tables alone may sufficiently address compliance criteria
- HIPAA compliance, risk management and analysis, and many others of the quality functions.
James will show how to use data visualization and optimize the effect of these areas. The following agendas will be part of the two-day presentation:
- Introduction and definitions
- Examples of data visualizations for compliance and regulated industries
- Historical context
- Characteristics of data
- Interactive data visualization exploration with Excel and websites
- Human side of data visualization
- Principles of good graphic design
- Data visualization methodology
- Best practices
- Software introduction: JMP
- Univariate plots
- Distributions and histograms
- Pie graphs, violin plots, pareto plots, box plots
- Conditional formatting
- Mulitvariate plots and heatmaps
- Correlation
- Multivariate scatterplots and density graphs
- Contour plots
- Categorical data plots: treemaps, mosaic plots
- Software introduction: R
- Software introduction: Tableau Public
- Univariate plots with R and Tableau
- Multivariate plots with R and Tableau
- Dynamic and interactive graphs
- Brushing, dynamic linking, and filtering
- Profilers on response variables and optimization
- Time series plots
- Waterfall plots
- Sparklines and trend lines
- Statistical Process Control charts
- Maps
- Text data visualization
- Dashboards
- Course summary.
Views: 17
Comment
MedTechIQ VideoLibrary
Upcoming Events
© 2026 Created by CC-Conrad Clyburn-MedForeSight.
Powered by
![]()
You need to be a member of MedTech I.Q. to add comments!
Join MedTech I.Q.